
OpenClaw Logging Tools: Logto vs. Custom Grafana Dashboards
Last verified: 2024-11-15 UTC
When you’re building applications with OpenClaw—especially those involving autonomous agents, real-time decision workflows, or distributed data processing—logging isn’t just an afterthought. It’s the nervous system of your system. Without reliable visibility, even the most sophisticated agent orchestration can run blind, leading to silent failures, delayed incident response, and fractured debugging cycles.
Two logging approaches dominate modern DevOps discussions: hosted solutions like Logto and highly customizable open-source stacks like Grafana. But when you layer in OpenClaw’s unique architecture—its event-driven agents, modular gateway design, and integration-first philosophy—the choice isn’t just about storage or UI. It’s about alignment with how your agents actually behave.
This article cuts through the noise. We’ll compare Logto and custom Grafana dashboards through the lens of OpenClaw, not generic DevOps. You’ll learn when each shines, where they fall short, and how to avoid common pitfalls—like over-automating log routing or underestimating observability debt. We’ll also link to real-world OpenClaw setups, including how teams are using custom RSS alerts and blockchain-adjacent logging patterns to enhance security and traceability.
Let’s get into it.
Why Logging Matters More in OpenClaw Than You Think
OpenClaw agents operate asynchronously, often across multiple contexts—like web3 smart contracts, legacy APIs, or human-in-the-loop workflows. Each agent can trigger cascading events: a price alert might trigger a trade, which triggers a notification, which triggers a reconciliation check. Without consistent, correlated logs, you’re left guessing whether a failure happened in the agent logic, the upstream data feed, or the downstream executor.
That’s why logging must be:
- Context-rich: logs should include agent ID, event type, input/output hashes, and execution latency—not just timestamps and messages.
- Cross-agent traceable: you need to follow a single action (e.g., “place trade”) across multiple agents.
- Secure by default: especially if agents interact with web3 systems or handle sensitive user data.
This is where many teams stumble. They adopt a generic logging stack and later realize their agents’ logs don’t align with OpenClaw’s event schema. Or worse, they try to force OpenClaw into a system designed for monolithic apps.
Let’s look at how Logto and Grafana stack up against OpenClaw’s requirements.
What Is Logto—and How Does It Fit OpenClaw?
Logto is a modern, open-source identity and access management (IAM) platform with logging capabilities. Though it’s best known for authentication (OAuth2, SSO, MFA), its newer logging module—Logto Logs—lets you collect, search, and alert on structured logs.
Key features:
- Structured JSON logging out of the box
- Real-time alerting (email, Slack, webhooks)
- Built-in role-based access controls (RBAC)
- Self-hosted or cloud options
But here’s the catch: Logto Logs is not a full observability suite. It doesn’t include metrics, traces, or dashboards. It’s focused on log ingestion and search. If you’re already using Logto for IAM, adding its logging module can be a low-friction way to centralize auth-related logs (e.g., agent login attempts, token refresh failures).
For OpenClaw, Logto Logs can be useful in two scenarios:
- Agent authentication auditing: If your agents authenticate with external APIs or internal services using OAuth tokens, Logto can log those events with full context (agent ID, client IP, timestamp).
- Human-agent handoff logging: When a human operator intervenes (e.g., approves a trade), Logto can log the action and tie it to the original agent request.
However, Logto’s logging module has limitations:
- No native support for OpenTelemetry or OpenClaw’s event schema
- Limited drill-down capabilities across distributed agents
- No built-in anomaly detection (you’d need to integrate with Prometheus or similar)
If you want to integrate Logto with OpenClaw, you’ll likely route logs via OpenTelemetry or syslog. We’ll show how in the setup section.
Want to understand how OpenClaw agents compare to other AI assistants in terms of logging and auditability? Our deep dive on OpenClaw vs. Microsoft Copilot covers how each handles user intent tracking and action provenance.
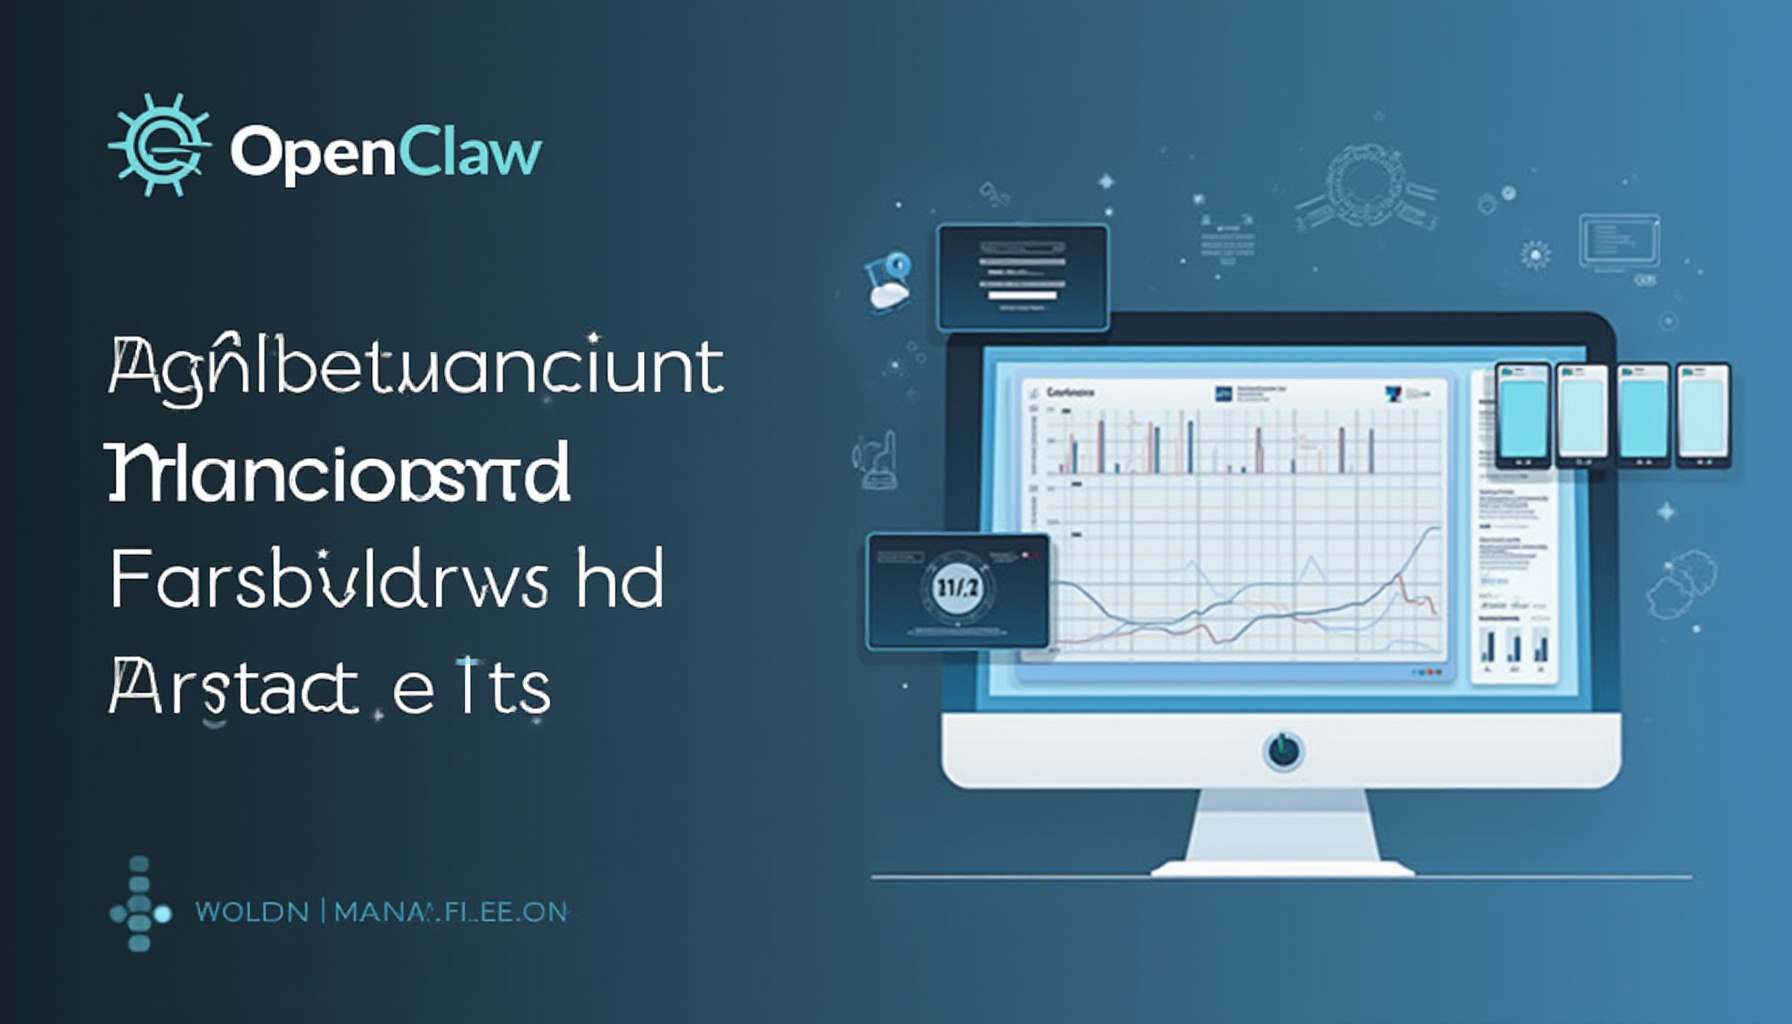
What About Grafana? Why Build Custom Dashboards?
Grafana is a visualization and observability platform. It doesn’t store logs itself—it pulls them from backends like Loki (its native log engine), Elasticsearch, or Splunk. Its real power lies in flexibility: you define queries, build panels, and layer alerts exactly how your agents behave.
For OpenClaw teams, Grafana + Loki has become a popular stack because:
- You can build dashboards that mirror your agent topology (e.g., per-agent log heatmaps)
- Custom queries let you surface events like “agent restarts in last hour” or “failed reconciliation attempts”
- Integration with Prometheus enables unified metrics/logs/traces (the “three pillars”)
But building a custom Grafana setup for OpenClaw isn’t plug-and-play. You need to:
- Normalize OpenClaw’s event logs into Loki-compatible JSON
- Define alert rules that avoid noise (e.g., don’t alert on expected agent restarts)
- Decide what to include: raw logs, summaries, or both?
The trade-off: Grafana gives you control but demands upfront effort. Logto gives you speed but limits depth.
Let’s compare them side by side.
Direct Comparison: Logto vs. Grafana for OpenClaw
| Feature | Logto Logs | Grafana + Loki (Custom) |
|---|---|---|
| Setup complexity | Low (can use existing IAM setup) | Medium–High (requires config for Loki, dashboards, alerts) |
| Agent context retention | Partial (needs manual enrichment) | Full (via structured JSON and tags) |
| Cross-agent traceability | Limited (no native distributed tracing) | Strong (via trace IDs and log correlation) |
| Custom dashboards | None (basic search UI only) | Full (drag-and-drop, templating, variables) |
| Alerting flexibility | Rule templates only (limited custom logic) | Full PromQL-style logic, multi-condition alerts |
| OpenTelemetry support | Yes (via OpenTelemetry Collector) | Yes (native) |
| Scalability for 100+ agents | Moderate (cloud tier recommended) | High (with proper Loki sharding) |
| Security posture | Enterprise IAM + audit logs | Self-managed (depends on your config) |
The table shows the core trade-off: Logto prioritizes ease and speed; Grafana prioritizes control and insight.
But let’s go beyond the table. Here’s what really matters in practice.
Scenario 1: You’re Building a Multi-Agent Trading Assistant
Imagine you’re building an OpenClaw-based trading assistant. One agent monitors market feeds, another validates trade rules, and a third executes orders on-chain. You want logs that show:
- Which agent triggered what
- Why a trade was rejected (e.g., insufficient balance, invalid signature)
- Latency between decision and execution
Logto approach:
- You’d configure Logto Logs to ingest agent logs via HTTP POST (or OpenTelemetry).
- Each agent’s log entry includes fields like
agent_id,event_type,input_hash,timestamp. - You set up alerts for
event_type="trade_rejected".
But here’s where you hit a wall: Logto can’t easily correlate a single trade’s journey across agents. You’d need to store trace IDs manually and search across time ranges—tedious and error-prone.
Grafana approach:
- You enrich logs with a
trace_id(e.g.,trade_request_abc123) at ingestion time. - In Grafana, you build a dashboard with panels like:
- Agent event timeline (time-series of events per agent)
- Trade success funnel (% of requests → validated → executed)
- Rejection root cause breakdown (pie chart of rejection reasons)
- You create a reusable “Trade Trace” panel template that accepts
trace_idas a variable.
With Grafana, you can click any rejection and instantly see the full chain of events—down to the exact agent that flagged the issue.
Scenario 2: You Need to Audit Human-in-the-Loop Actions
In regulated environments (e.g., finance, healthcare), you must log who approved what—and when. OpenClaw supports human-in-the-loop workflows via its gateway layer, where operators can override or approve agent actions.
Logto advantage: If you’re already using Logto for IAM, it can log human approvals natively. For example:
{
  "event": "human_approval",
  "user_id": "[email protected]",
  "agent_id": "risk-checker-v2",
  "request_id": "req_789",
  "approved": true,
  "timestamp": "2024-11-10T14:30:22Z"
}
This integrates seamlessly with your existing access controls and audit trails.
Grafana advantage: You can build a dashboard that overlays human actions on top of agent activity. For instance:
- A timeline showing when Alice approved 10 trades in a row (possible fatigue indicator)
- A heatmap of approval latency by time of day
- Alerts if an operator approves >15 trades/minute (possible bypass risk)
Neither tool alone solves everything—but used together, they cover more ground.
How to Set Up Logto Logs with OpenClaw (Step-by-Step)
If you choose Logto Logs, here’s a practical setup:
-
Create a Logto project
Go to logto.io and set up a new project. Enable the Logs feature in the admin console. -
Generate an API key
Under Settings > API Resources, create a new resource for “OpenClaw Logs” and copy theClient IDandClient Secret. -
Ingest logs via OpenTelemetry Collector
Since OpenClaw emits JSON logs, use the OpenTelemetry Collector to forward them:receivers: otlp: protocols: grpc: http: exporters: logto: endpoint: "https://logto.example.com/api/logs" client_id: "${LOGTO_CLIENT_ID}" client_secret: "${LOGTO_CLIENT_SECRET}" service: pipelines: logs: receivers: [otlp] exporters: [logto](Replace
logto.example.comwith your Logto domain.) -
Enrich logs with agent context
In your OpenClaw agents, ensure logs include:resource.attributes.agent_idresource.attributes.workflow_idbody.event_type
This lets Logto’s search UI group logs by agent or workflow.
-
Set up alerts
Use Logto’s alerting UI to create rules like:“Alert me if
event_type = 'agent_crash'occurs >3 times in 5 minutes.”
🔔 Pro tip: Avoid alert fatigue by adding context. Instead of alerting on raw crashes, alert only if the crash happened during a critical workflow (e.g.,
workflow_id = 'trade-execution').
How to Build a Grafana + Loki Stack for OpenClaw
Grafana’s setup is more involved but pays off in visibility.
Step 1: Ingest OpenClaw Logs into Loki
Loki accepts JSON logs via HTTP or Promtail. For OpenClaw, we recommend using Promtail with a custom pipeline:
-
Install Promtail on each OpenClaw node.
-
Configure
promtail-config.yaml:scrape_configs: - job_name: openclaw_agents static_configs: - targets: - localhost labels: job: openclaw agent_group: trading_agents pipeline_stages: - json: expressions: event_type: event_type agent_id: agent_id - labels: event_type: agent_id: - timestamp: source: timestamp format: RFC3339 -
Forward logs to Loki:
loki_address: "http://loki:3100/loki/api/v1/push"
Step 2: Build Your Dashboard
In Grafana:
- Create a new dashboard.
- Add panels:
- Agent health: Log rate over time (query:
sum by(agent_id) (rate({job="openclaw"}[5m]))) - Error heatmap:
count_over_time({job="openclaw", event_type="error"}[1h]) by (agent_id) - Workflow trace: Use
label_values({job="openclaw"}, workflow_id)as a templating variable.
- Agent health: Log rate over time (query:
Step 3: Add Alerts
Create an alert for:
“If
count_over_time({job="openclaw", event_type="rejection"}[10m]) > 5, trigger PagerDuty.”
You can even tie this to OpenClaw’s webhook system—e.g., send a Slack message to #agent-alerts with a link to the full trace.
📡 Want to extend alerts beyond email or Slack? Our guide on setting up custom RSS alerts in OpenClaw shows how to push alerts into RSS feeds—useful for legacy systems or team dashboards.
Common Pitfalls (And How to Avoid Them)
Pitfall 1: Logging Too Much (or Too Little)
- Symptom: Logs fill disk in hours; search times explode.
- Fix: Use sampling. In OpenClaw, set
log_sample_rate: 0.1for non-critical agents, and log 100% for key events (e.g.,trade_executed,security_alert).
Pitfall 2: Ignoring Log Rotation
- Symptom: Agents crash because
/var/logis full. - Fix: Use
logrotatewith Loki or Logto’s built-in retention policies (e.g., 30 days for logs, 7 days for debug logs).
Pitfall 3: Treating Logs as “Just Text”
- Symptom: You can’t correlate events across agents.
- Fix: Enforce a schema. Define required fields (
agent_id,trace_id,timestamp) in your logging library (e.g.,pino,winston).
Pitfall 4: Overlooking Security
- Symptom: Logs contain PII or API keys.
- Fix: Redact before ingestion. Use OpenTelemetry’s
attributesprocessor or Promtail’spipeline_stagesto strip sensitive fields.
🛡️ Security note: If your agents interact with web3 systems, consider hashing log payloads (e.g.,
input_hashinstead of raw transaction data). For more on this, see our exploration of the OpenClaw–blockchain intersections, including how to verify log integrity using Merkle trees.
When to Choose Logto vs. Grafana: A Decision Tree
Still unsure? Use this flow:
-
Do you already use Logto for IAM?
→ Yes: Start with Logto Logs for auth-related events. Add Grafana later if you need deeper insights.
→ No: Skip to step 2. -
Do you need real-time dashboards for agent performance?
→ Yes: Grafana + Loki.
→ No: Logto Logs may suffice. -
Are you building a regulated product (e.g., fintech)?
→ Yes: Grafana + Loki gives you full control over audit trails.
→ No: Logto’s speed wins for MVPs. -
Do you have DevOps bandwidth?
→ Yes: Grafana.
→ No: Logto.
Hybrid Approach: Logto + Grafana Together
The best of both worlds isn’t theoretical—it’s practical.
Here’s how one OpenClaw team structured it:
- Logto handles auth logs, human approvals, and security events.
- Grafana + Loki handles agent behavior, performance, and error trends.
They route logs like this:
OpenClaw Agents
     ↓ (OpenTelemetry)
     ├─→ Logto Logs (auth + human events)
     └─→ Loki (all other events)
           ↓
         Grafana
This splits concerns cleanly:
- Logto’s IAM strength + Grafana’s visualization power.
- Reduced load on Grafana (no auth logs cluttering dashboards).
- Clear ownership: security team manages Logto; platform team owns Grafana.
🤖 Curious how this compares to using Slackbots for agent notifications? Our piece on OpenClaw vs. Slackbots for agentic AI covers why dedicated logging beats chat-based alerts for complex systems.
Building a Custom Gateway Log Viewer (Bonus)
If you’re building internal tools, consider embedding a lightweight log viewer directly in your OpenClaw gateway UI. This is where custom gateway chat apps shine.
For example:
- Use OpenClaw’s gateway API to fetch logs by
agent_idortrace_id. - Render them in a React panel with collapsible fields.
- Add a “Replay” button to re-run the last event (with redacted inputs).
This gives agents’ creators instant feedback without leaving the interface.
FAQ: Logging in OpenClaw
Q: Can I use Logto Logs for agent-to-agent communication?
A: Not directly. Agent logs are outputs—not real-time messages. Use WebSockets or message queues (e.g., NATS) for agent comms, and log the outcomes.
Q: How do I correlate logs across multiple OpenClaw instances?
A: Use a distributed trace ID. Generate it at the gateway layer (e.g., x-trace-id header) and propagate it to all agents. Both Logto and Grafana support this.
Q: Is Grafana’s Loki free?
A: Yes—Loki is open source and free. Grafana Core is free; Grafana Enterprise adds advanced features.
Q: What if I need both logs and metrics?
A: Grafana + Loki + Prometheus is the standard combo. Logto doesn’t cover metrics natively.
Q: Do OpenClaw agents log to stdout or files?
A: By default, they log to stdout (JSON). Use a sidecar (e.g., Fluentd) to ship to your logger.
Final Thoughts: Choose Based on Your Agents’ Needs
Logto Logs is a great fit if you want fast, secure logging with minimal setup—especially for IAM-related visibility. Grafana + Loki is the way to go if you need deep, real-time insights into agent behavior, performance, and anomalies.
But remember: logging is only as good as your ability to act on it. The best setup is the one your team uses consistently—not the most feature-rich one gathering dust.
Start small. Pick one high-impact event (e.g., agent crashes) and build visibility around it. Then expand.
And if you’re building something unique—like an agent that interacts with blockchain or human teams—lean into OpenClaw’s strengths. The ecosystem is rich, and your logs should reflect that.
This article reflects real-world OpenClaw deployments as of 2024-11-15. Tool versions and APIs may evolve; always consult the latest documentation.